Process Lasso is Windows process automation and optimization software. From tuning algorithms like ProBalance to user-created rules and persistent settings such as CPU affinities and priority classes, Process Lasso enables you full control over running applications!
Our famous ProBalance algorithm maintains system responsiveness during high CPU loads. This proprietary algorithm dynamically adjusts the priorities of running programs so that some are given higher priority access to the CPU(s) than others. With ProBalance, no longer will single, or multiple, processes be able to bring your system to a virtual stall. Process Lasso will let you keep interacting with your computer, even when it is under a heavy CPU load. Try our CPUEater Demo to experience ProBalance for yourself.
Process Lasso also allows users to automate and tweak how applications are run through a number of unique and helpful functions. These include persistent priority classes, persistent CPU affinities, disallowed processes, per-process power profiles, a process watchdog for advanced rules, process instance count limits, instance or app balancing and much more! These features give you the ability to control how programs utilize your computer’s resources based on automatically applied settings. With Process Lasso, you can decide exactly how you want your processes to run.
Many additional functions such as power plan automation, a system responsiveness metric and process activity logging are also available.
For minimal resource use, all algorithms and process rules are enforced by a stand-alone background service called the Process Governor. The GUI is entirely optional.
Windows 7, 8, 10, 11
Windows Server 2012-2025
For Windows XP, 2003, and Vista see this version. For Windows 2000, go back to this version.
Process Lasso consists of a core engine and a user interface. The two are separated so that users can completely close the user interface while keeping Process Lasso active, managing processes. The core engine is run as ProcessGovernor.exe, while the user interface is ProcessLasso.exe. Running only the core engine results in memory usage of a mere 1-3MB (typically) and almost no CPU use. When the user interface, ProcessLasso.exe, is launched it automatically launches an instance of the ProcessGovernor.exe core engine if one isn’t already running for the current user, or as a service. When you close the user interface, you are asked whether you want to keep the core engine running or not. By default, each user session has their own instance of ProcessLasso.exe and ProcessGovernor.exe. An alternate popular configuration would be to run the governor as a service and the GUI as-necessary.
| Component | Filename | Description |
|---|---|---|
| Graphical User Interface (GUI) | ProcessLasso.exe | This graphical user interface (GUI) serves the purposes of configuring process rules and features, displaying running processes and recent activity (logs) by the Process Governor service. It also hosts the system tray icon. |
| Core Engine (Governor) | ProcessGovernor.exe | This non-interactive system service, called the Process Governor or ‘core engine’, does the actual work of applying process rules and algorithms. It can run stand-alone without the GUI for minimal resource use. |
| Session Agent | bitsumsessionagent.exe | This tiny process facilitates Process Lasso’s retrieval of select information about each interactive user session, namely the foreground process ID and the last input time (for the idle timer). This data is used by ProBalance and IdleSaver. The Keep Awake and Prevent Sleep functions also rely on this process and will not function properly if it is not running. The bitsumsessionagent.exe process has virtually zero overhead so its startup task should not be disabled. |
| Configuration File | prolasso.ini | This configuration file holds the process rules and options for Process Lasso. The path can be changed via ‘Options / General / Configure Startup…’. |
| Log File | prolasso.log | This log file keeps a record of recent actions. It can be disabled. The path can be changed using ‘Options / General / Configure Startup…’. This file is in a CSV format. |
The main window consists of a CPU utilization and system responsiveness graph, a list of running processes, and a list of recent actions (log). The configuration of Process Lasso is made easy to tweak through the menu system. In the main menu you’ll find all the general configuration options. Right-clicking on a process, or multiple processes, shows available operations on those process(es).
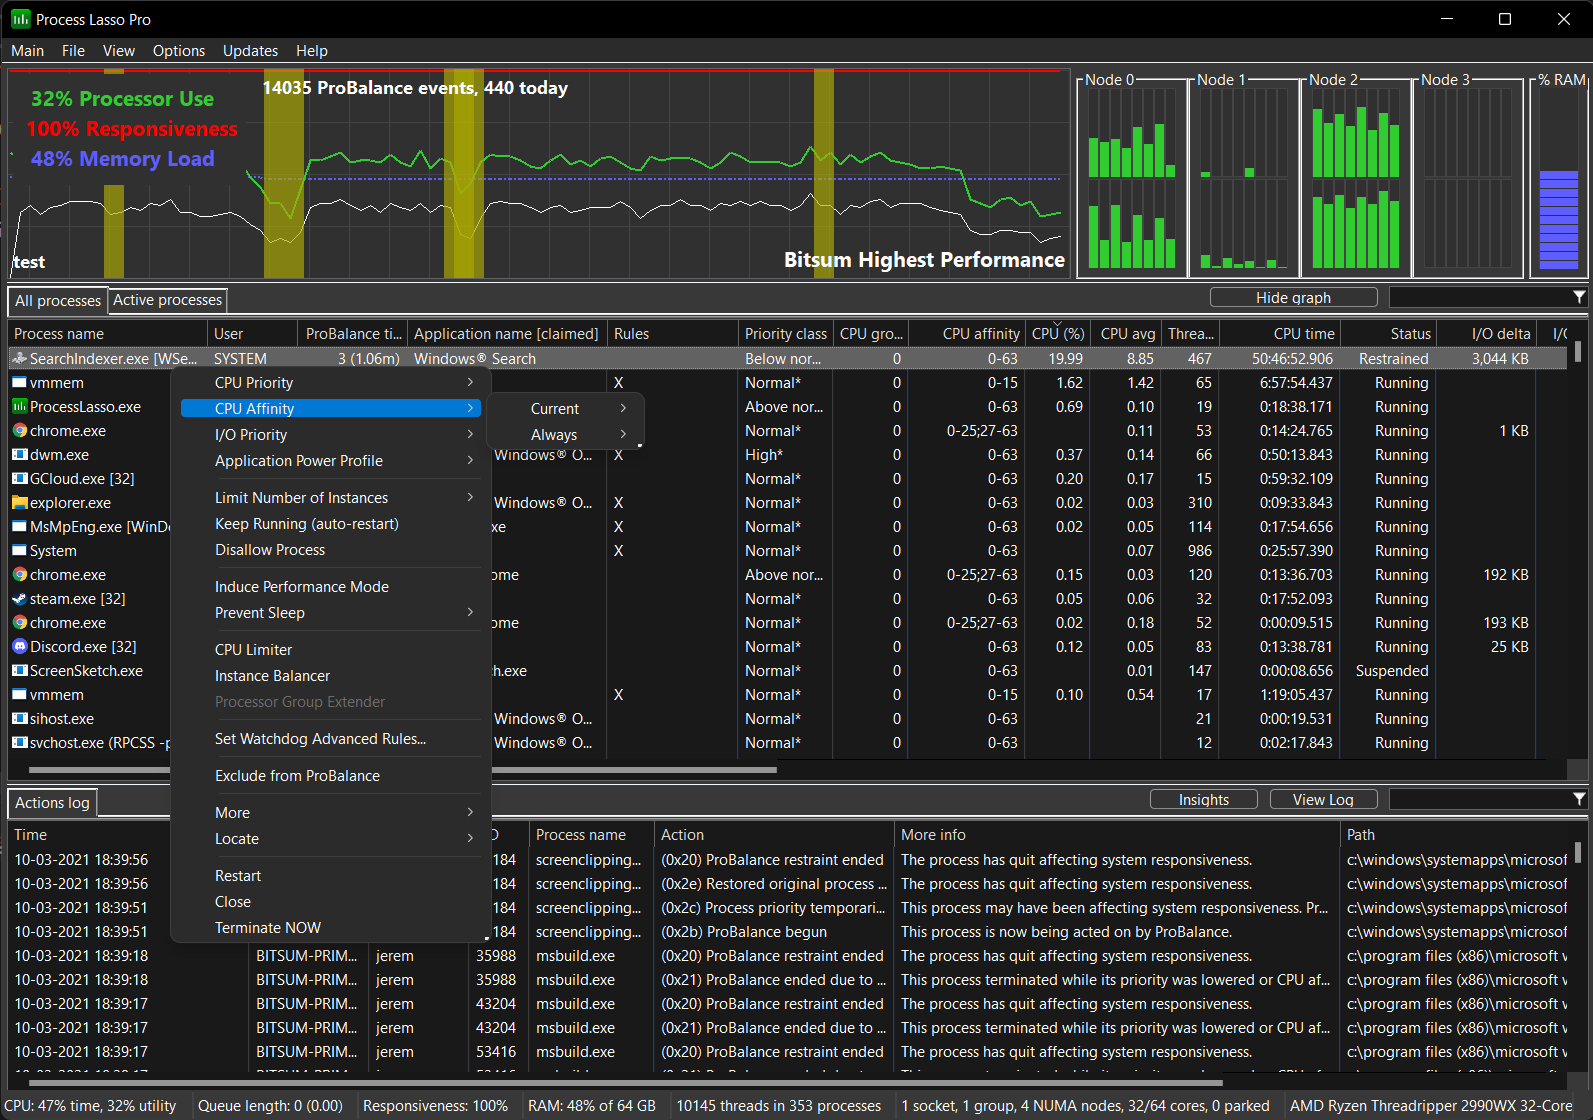
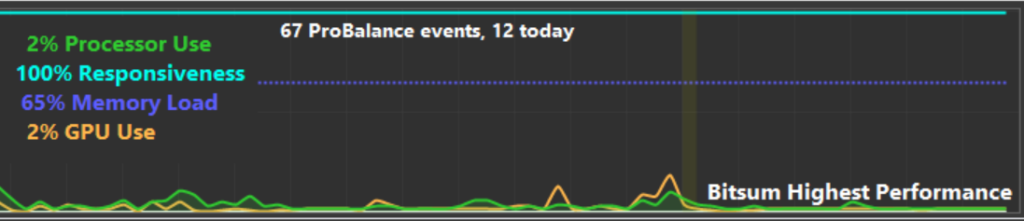
The Process Lasso graph shows a calculation of system responsiveness, overall CPU and GPU utilization, and the memory load. The system responsiveness is calculated using a proprietary algorithm that measures the latency in the user interface (windowing) subsystem.
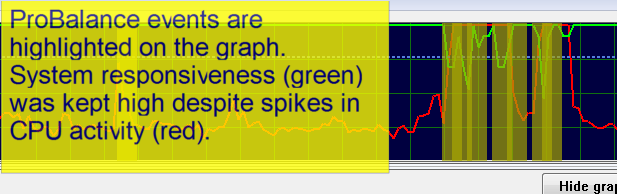
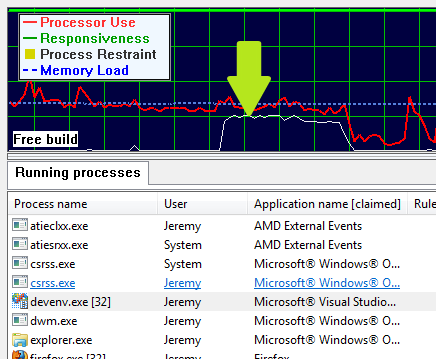
Highlighted portions of the graph indicate that a ProBalance process restraint occurred during that period. This can help you see the impact of Process Lasso on system responsiveness.
During periods when ProBalance takes action to ensure your system responsiveness remains high despite a spike in CPU use, the graph will be highlighted. The log can be referenced to see what actions were taken.
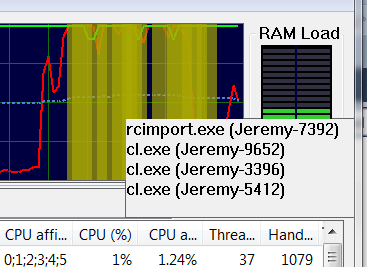
Hovering over a highlight event will show you the process(es) adjusted (in priority or CPU affinity) at that time.
GGPU utilization is shown on the primary graph, a dedicated widget, status bar, and in the process lists.
Since any inspection of GPU performance data incurs some amount of overhead, often showing up in ntoskrnl.exe, this data is only collected when Process Lasso is visible. Due to this, some periods of GPU data may be missing from the graph. GPU utilization reporting can also be disabled entirely in the “View / Graph Components” menu.
With Process Lasso you can see the individual CPU history of process(es) you select in the process list. The CPU utilization history of all processes currently selected (highlighted) in the process list is drawn as a smaller white line on the graph. For example, the user below selected ‘devenv.exe’ and its CPU history was drawn onto the graph as a white line.
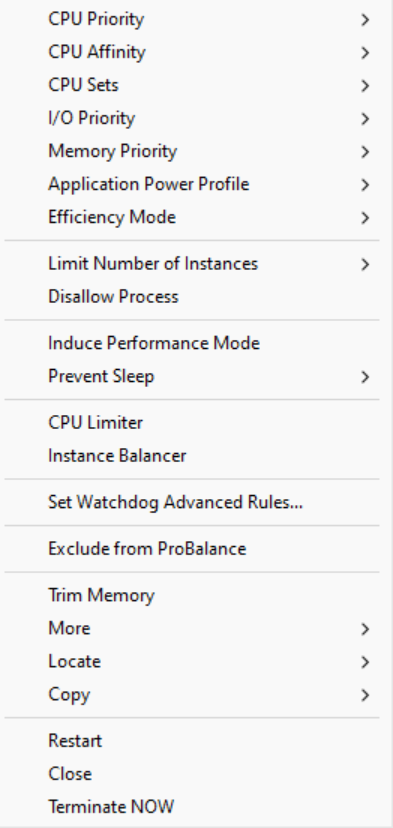
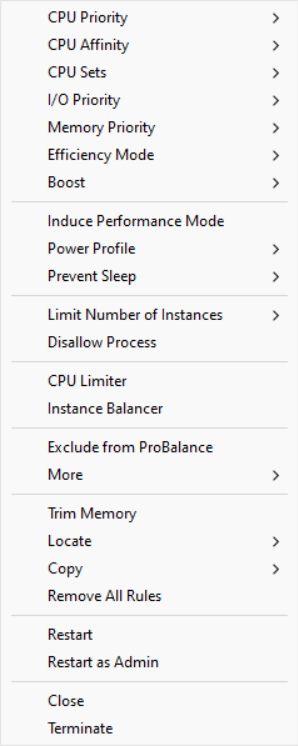
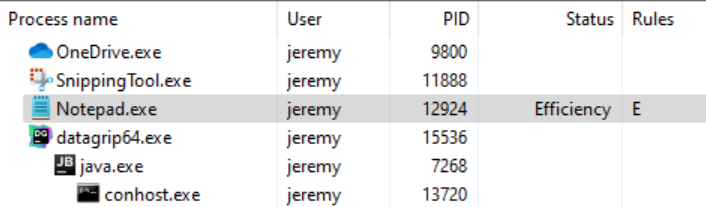
The Process List shows running processes and allows for easy rule creation. You can right click on any process, or on multiple processes, to get a context menu of available options. Among many other things, the options include setting current priorities and affinities, as well as default priorities and affinities.
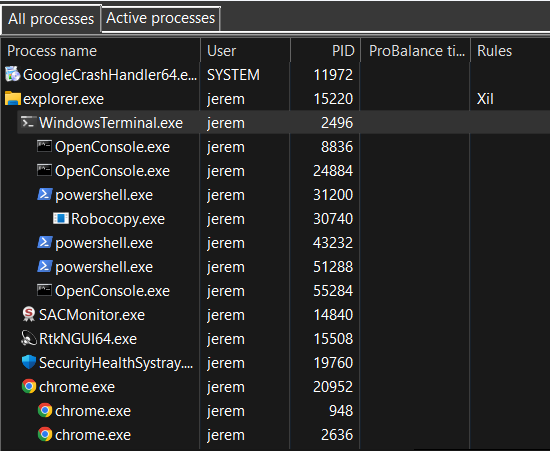
The tree view provides a way to visualize the process parent/child hierarchy. Many applications spawn child processes, resulting in several same-named instances, thus this new tree view makes managing them easier. It also helps with visualizing the state of the system and specific user activity.
Left-clicking on the ‘Process name’ header will rotate between tree and classic ordering. Left-clicking on any other column will end the tree view and sort by that column. Alternatively, the tree view can be toggled via a ‘View’ menu item.
The context menu when multiple processes are selected is different than when a single process is selected, since not all operations can be performed on multiple processes.
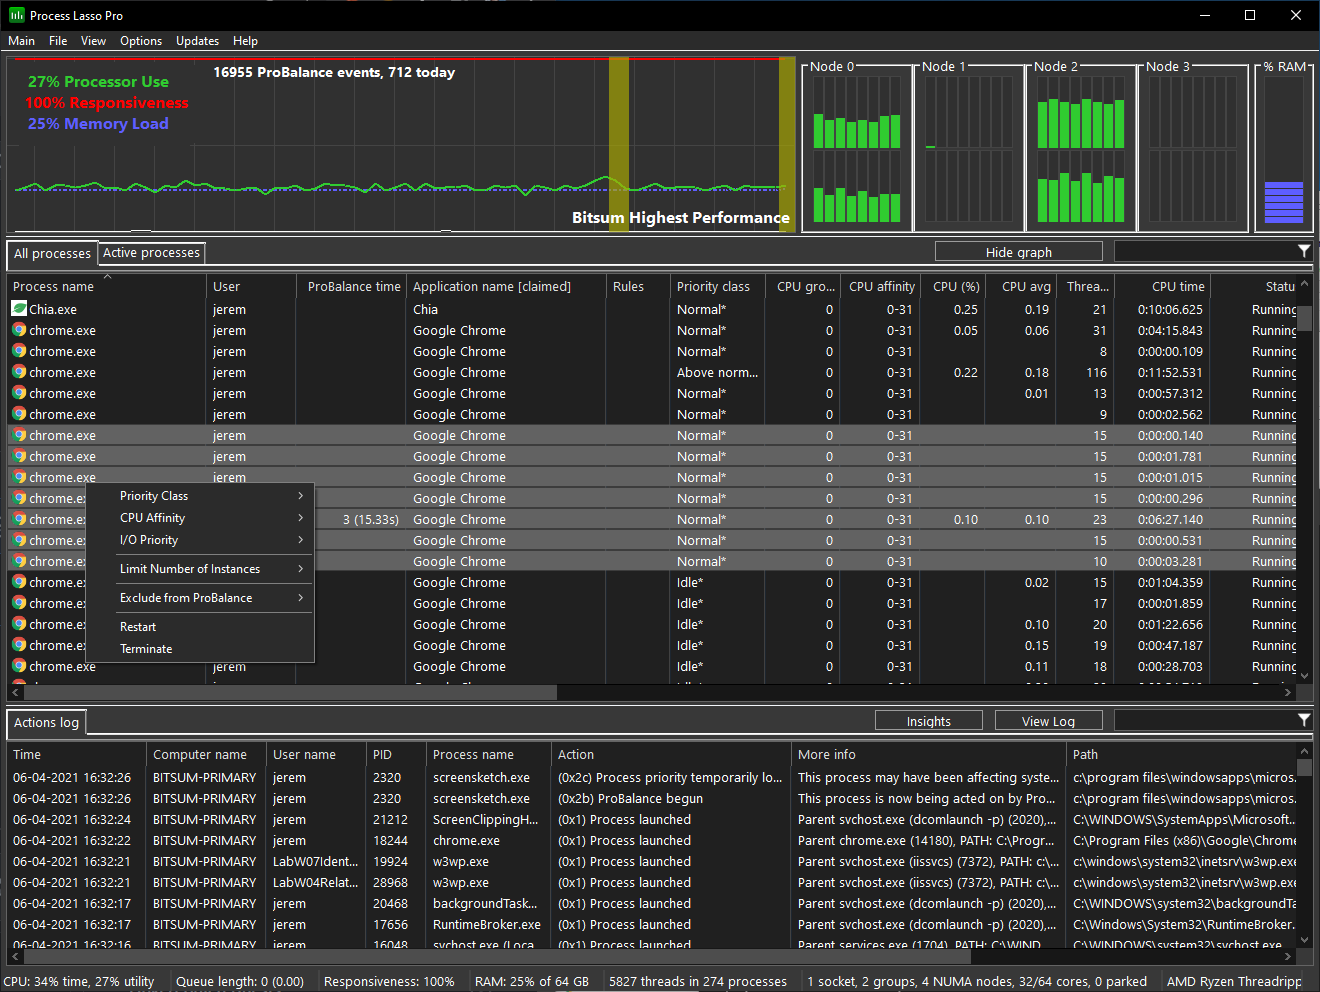
With Process Lasso you can select multiple processes at once and operate on them. Not all functions are available when multiple processes are selected, but most common ones are.
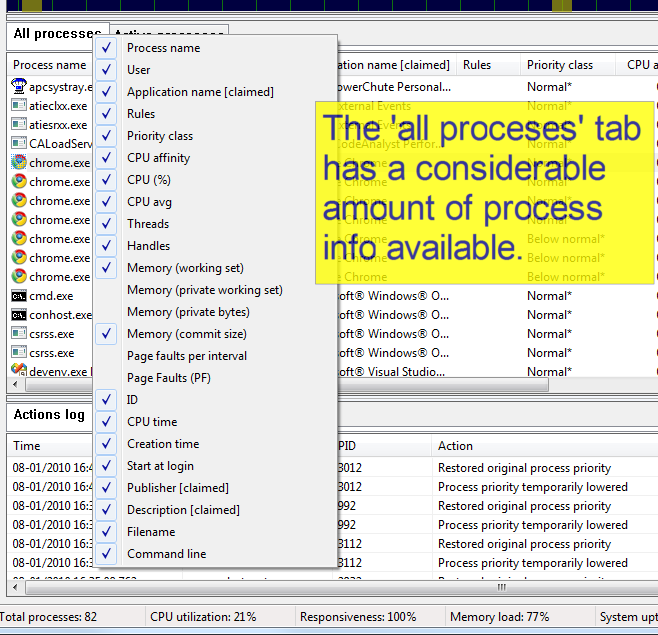
You can select which columns you want visible by right-clicking on the ‘All processes’ tab, right-clicking on the list header, or using the ‘View / Select Process Columns’ menu. In addition, you can resize the columns (at their headers) and change the column ordering by dragging the column headers. These view changes will be remembered by Process Lasso. The same applies for the ‘Active processes’ tab. Note that right-clicking the ‘Active processes’ tab allows for setting process information shown in that column. Information in the ‘Active processes’ tab is more limited than information in the ‘All processes’ tab. However, double clicking on any process in the ‘Active processes’ tab will take you to its entry in the ‘All processes’ tab.
The Rules column in the process list provides a shorthand notation of rules set for each process.
Format: [+|-][X][E|e][L][_][x][W][g][K][#n][d|D][f][p][Mx][t][s][iX][<..<<<<][RHANBI][0-63](0-63)
| Character(s) | Meaning |
|---|---|
| + | Dynamic Thread Priority Boosts ON |
| – | Dynamic Thread Priority Boosts OFF |
| X | Excluded from ProBalance |
| E | Efficiency Mode ON |
| e | Efficiency Mode OFF |
| L | CPU Limited |
| _ | Instance Balanced |
| W | A watchdog rule is set |
| g | Process induces Performance Mode |
| K | Keep running (restart if terminates) |
| #n | Instance count limit of n, e.g. #2 for a limit of 2 |
| d|D | Prevents sleep of PC, or PC and display, respectively |
| x | Excluded from foreground boosting |
| f | IdleSaver is disabled when this process is running |
| p | Has a power plan rule |
| M# | Where ‘#’ is the memory priority set for this process. |
| t | Excluded from SmartTrim |
| R | Priority class: Real time |
| H | Priority class: Highest |
| A | Priority class: Above normal |
| N | Priority class: Normal |
| B | Priority class: Below normal |
| I | Priority class: Idle |
| ih | I/O priority class: High |
| in | I/O priority class: Normal |
| il | I/O priority class: Low |
| ib | I/O priority class: Very Low (background) |
| 0-63 | CPU Affinity |
| (0-63) | CPU Set |
| < | Hard throttle: lowest |
| << | Hard throttle: low |
| <<< | Hard throttle: moderate |
| <<<< | Hard throttle: high |
Possible values can be any combination of:
The amount of time this specific process instance has been under ProBalance restraint. It is not the accumulated total for all historical instances of that process; for that, use the ‘Insights’ button to launch the ProBalance Insights tool.
You can select which columns you want visible in the ‘Active Processes’ tab the same way you can in the ‘All Processes’ tab by right-clicking on the ‘Active processes’ tab or by right-clicking on the list header. In addition, you can resize the columns (at their headers) and change the column ordering by dragging the column headers. These view changes will be remembered by Process Lasso. Double clicking on any process in the ‘Active processes’ tab will take you to its entry in the ‘All processes’ tab, where additional information is available.
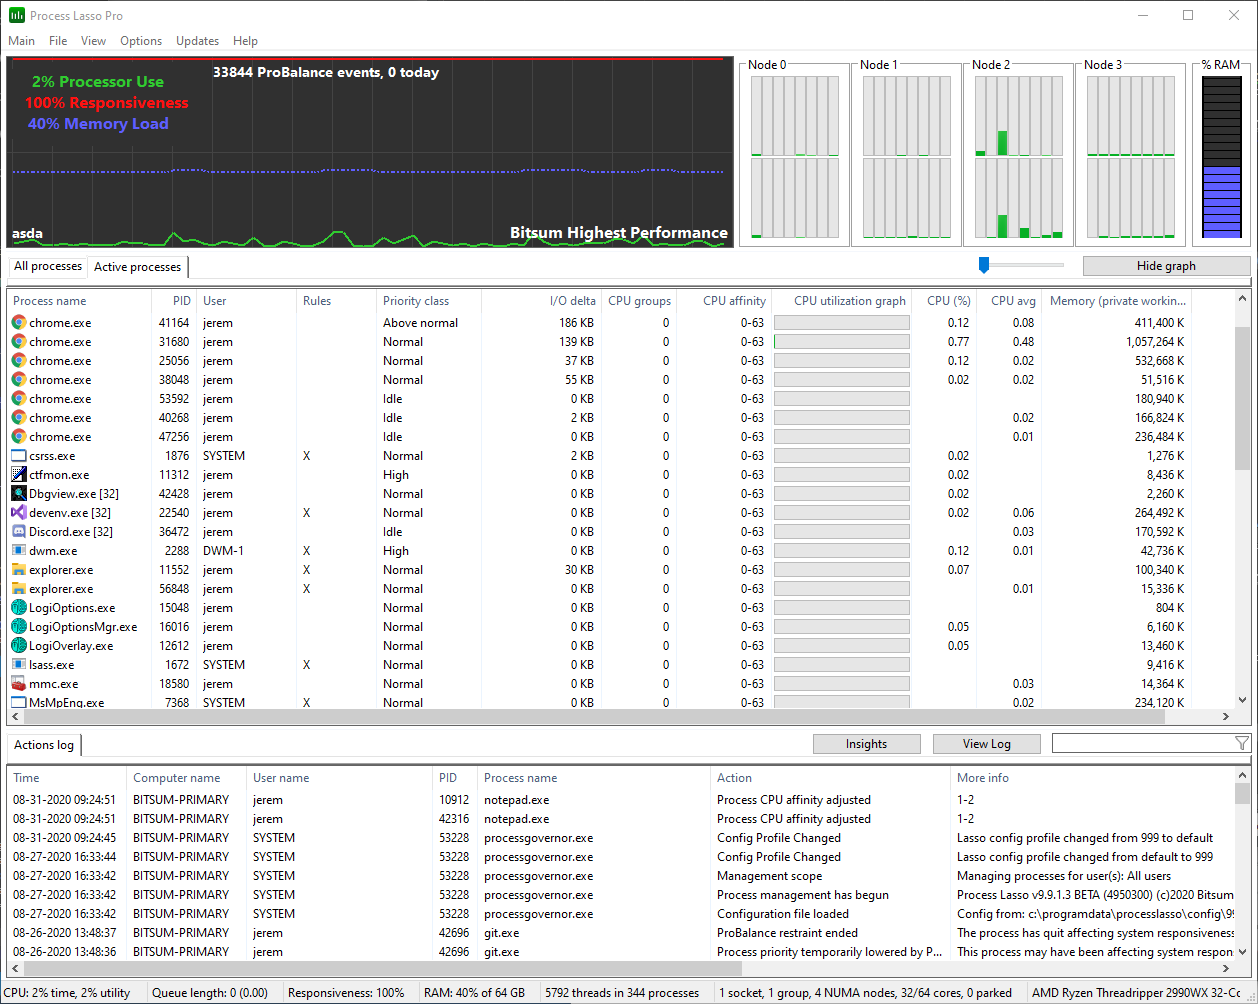

The Active Processes tab shows only processes that are actively utilizing the system CPU(s). It displays basic information about them, and a horizontal bar graph to visually depict their active CPU utilization.
Right-clicking on one or more of the processes in the ‘Active Processes’ list show the same context menu as found in the ‘All Processes’ tab.
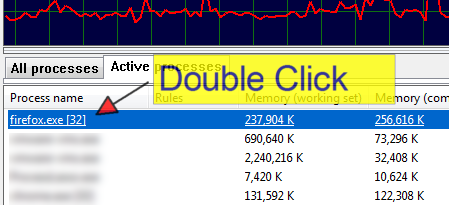
Double-clicking on a process in the ‘Active Processes’ list will find the corresponding process in the ‘All Processes’ tab and make it visible.
You can double click a process in the ‘Active processes’ tab to go to that process in the ‘All processes’ tab, where extended information is available.
The slider determines how much CPU activity it takes for a process to be listed in the ‘Active processes’ tab. Moving it to the right increases the threshold, so it takes more CPU use for a process to make it to the list. The left-most slider position is 0.01%, then each increment adds 1%. It may take a few seconds for an adjustment to the threshold to become apparent.
Do you need to:
These are some of the many automation capabilities of Process Lasso! Take control of your PC through your own manual rules or let Process Lasso’s automated algorithms do it for you.
Wildcards are accepted in most rules, along with Regular Expressions for more complex matching. Read more here.
Process Lasso’s automation capabilities include:
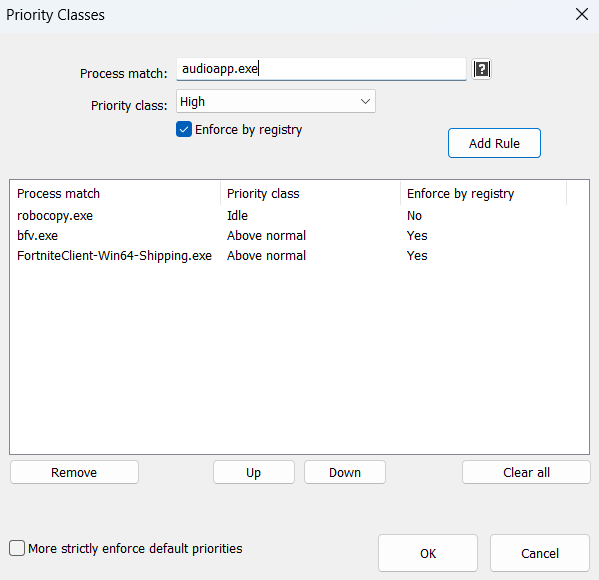
Priority classes, sometimes referred to as ‘CPU Priorities’ in Process Lasso, are available to keep applications running at specific priorities.
It is generally best to focus on lowering priorities of background and unimportant processes, rather than raising the priorities of important ones. This is simply due to the design of Windows. The ProBalance algorithm applies these adjustments to CPU heavy background processes dynamically.
Priority classes available in Windows are:
Normally setting the priority class is sufficient, but I/O priorities and memory priorities can also be set using their corresponding menu items and dialogs.
The menu item “Windows dynamic thread priority boosts enabled” can be checked to disable that native Windows feature. This is the same setting reflected in the “Boost” context menu item.
With AI workloads increasingly competing for GPU resources, we felt it important to add GPU priority support to Process Lasso. Now users can ensure that their most important GPU workloads, such as gameplay, are prioritized.
Available GPU priority classes are the same as CPU priority classes:
A new GPU priority column is shown in the process lists that indicates the GPU priority class.
Users can set GPU priority rules via the process context menu or by menu item “Options / GPU / GPU Priorities…”.
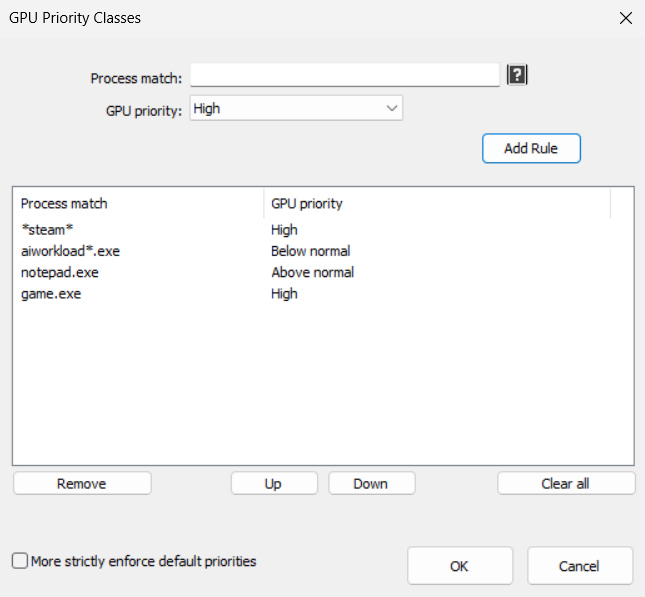
Unfortunately, GPU priority classes are not inherited by child processes and “Enforce by Registry” (IFEO) methods are not supported. This means that processes protected by anti-cheat systems won’t be able to have their GPU priorities set. In these cases, we instead recommend focusing on ensuring other processes with GPU workloads are set to below normal or idle priorities.
I/O priorities provide a hint to the OS about the relative importance of I/O for a process. However, no guarantee is made about prioritization over other I/O, or specific QoS parameters.
Memory priorities provides a hint to the OS about the relative importance of memory pages when they are being paged out.
… [one] should lower the default memory priority of threads that perform background operations or access files and data that are not expected to be accessed again soon. For example, a file indexing application might set a lower default priority for the process that performs the indexing task.
Memory priority helps to determine how long pages remain in the working set of a process before they are trimmed. A process’s memory priority determines the default priority of the physical pages that are added to the process working set by the threads of that process. When the memory manager trims the working set, it trims lower priority pages before higher priority pages. This improves overall system performance because higher priority pages are less likely to be trimmed from the working set and then trigger a page fault when they are accessed again.
SetProcessInformation function (processthreadsapi.h) – Win32 apps | Microsoft Learn
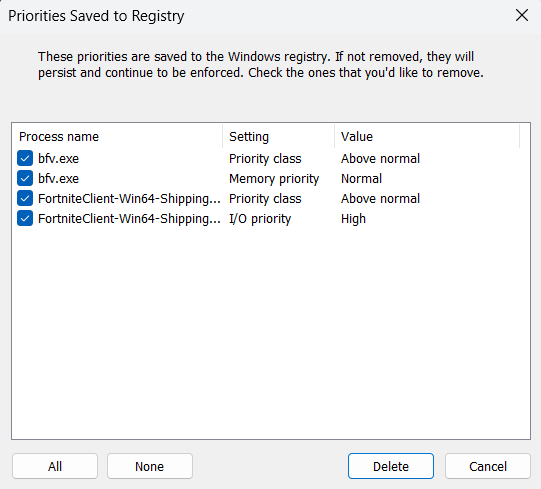
This option uses the Windows Image File Execution Options feature to save the priority to the registry so that every time that process is launched it will start with the chosen priority. This has the advantage of circumventing anti-cheat systems that may be protecting a process from modification. It has the disadvantage of persisting in the registry, so these settings may go unnoticed and forgotten about if not managed with a tool like Process Lasso.
This feature supports priority classes, I/O priorities and memory priorities. CPU affinities and other rule types are not supported.
Use of this method is benign so is not known to cause any alerts within anti-cheat systems. The priority restriction enforced by anti-cheat systems is more a side-effect of the process protection, rather than one of the aims.
Dynamic thread priority boosting is a native feature of Windows that temporarily boosts the priority of threads when they wake to resume work. It defaults to ON for new processes and should normally remain ON.
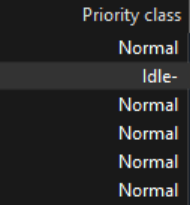
When dynamic thread priority boosts are disabled for a process, the priority class name will have a hyphen appended to it. You can toggle boosts on or off using the “Boost” context menu or “Options / CPU / Dynamic Thread Priority Boosts…”.
CPU Affinities control which CPU cores a process is allowed to use. Its threads will only be scheduled to that set of CPUs. This is useful to limit max CPU consumption of a process, or to optimize which CPU cores are dedicated to specific apps, games or services. If you want to instead dynamically reduce the set of CPU cores a process has access to in order to limit CPU use, try the CPU Limiter.
The optional ‘Delay’ field specifies how many seconds after process startup to apply the CPU affinity. In some cases, games or apps may be sensitive to CPU affinity changes during their startup phase, and this is intended to mitigate that. Another use is to give a process access to the full CPU while it is loading, then restrict it.
Multi-group (>64 logical CPU cores) processes have system restrictions on CPU affinities. Process Lasso will make a best effort to move threads to your chosen CPU affinity, but new threads of a process won’t be constrained to the desired CPU affinity without continuous reapplication of the affinity. Process Lasso will do this automatically if you create a persistent CPU affinity rule. However, you may instead want to use the CPU Sets feature, a softer form of CPU affinity, since it does not have these multi-group restrictions.
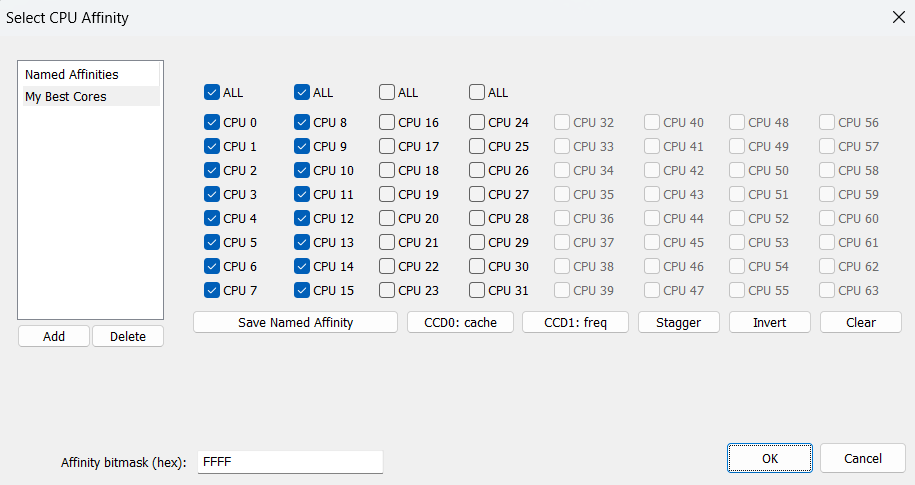
This process context menu item nested under ‘CPU Affinity’ disables SMT or Hyper-Threading by enforcing a CPU affinity that only includes one logical CPU core from each physical CPU core. On most CPU models this results in an alternating CPU Affinity pattern.
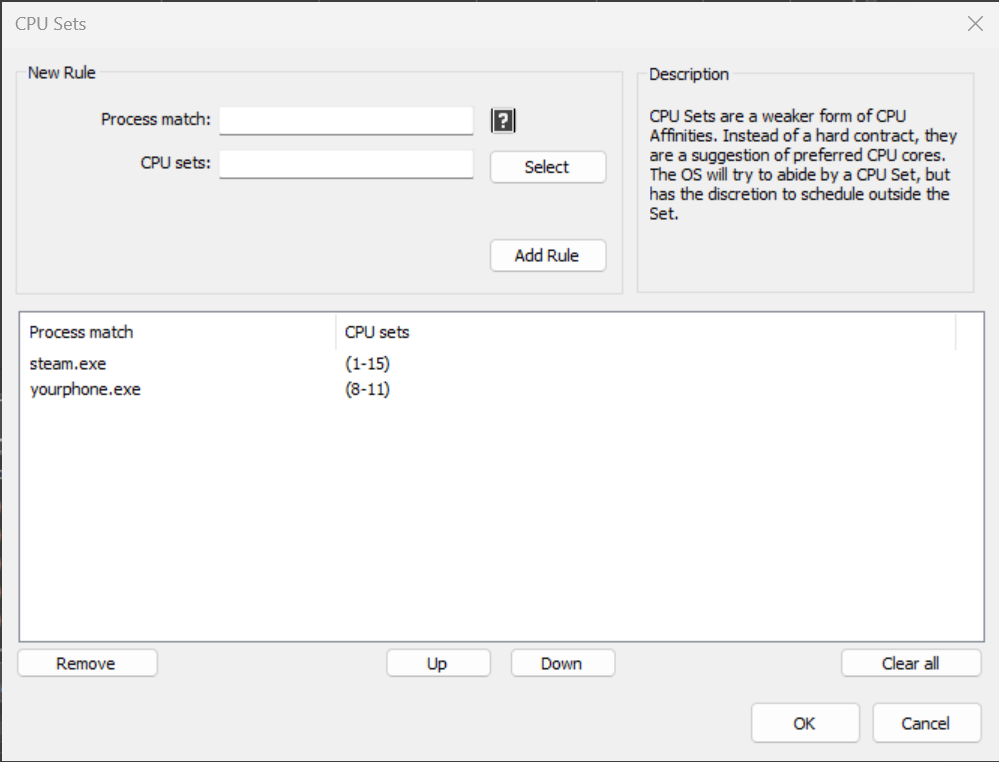
CPU Sets, a native Windows feature, are a ‘softer’ form of CPU Affinities. Instead of a hard contract, they are a suggestion of preferred CPU cores. The OS will try to abide by a CPU Set, but has discretion to schedule outside the Set. This may be necessary when the thread load exceeds the number of cores in the Set, or for power management reasons.
CPU Sets give the OS thread scheduler more flexibility than CPU Affinities do. If a process with a CPU Sets rule needs more CPU(s) to handle its thread load, the OS can schedule onto CPUs outside the assigned Sets. In contrast, a CPU Affinity can not be violated, so the process’s compute would be limited. Therefore, for performance tuning, CPU Sets are usually preferred. For hard limits on CPU consumption, traditional CPU Affinities should be used.
Some apps and games are sensitive to CPU Affinity changes. In these cases, CPU Sets are a viable alternative since they are less likely to cause complications.
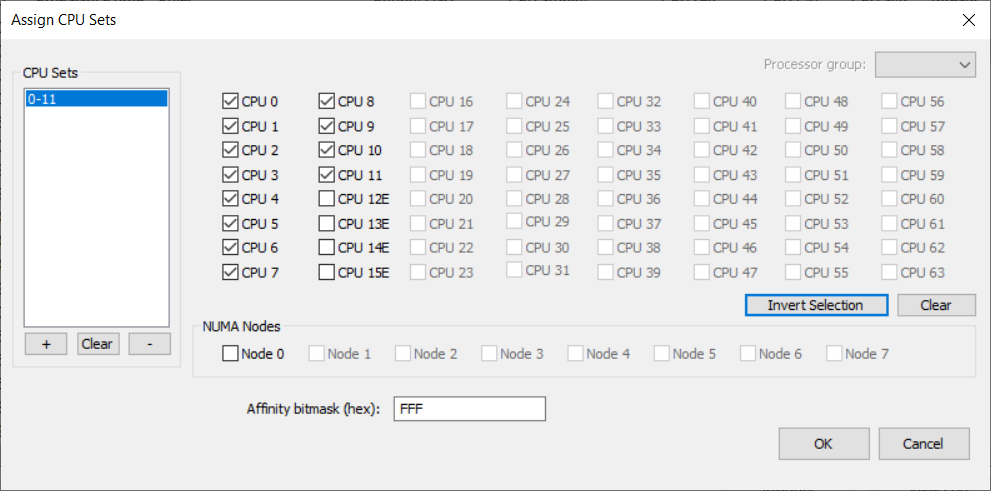
On Intel 12th Gen CPUs (Alder Lake), CPU Sets can be used to signal the OS to only utilize Performance (P) or Efficient (E) cores, or some mix of each, for a process. Many users will find CPU Sets an ideal method to disable E-cores for select applications.
On systems with more than 64 logical CPU cores, where Windows uses processor groups, a process’s CPU Sets may span multiple processor groups. Therefore, you will add multiple sets to the CPU Sets to span more than one group. That’s what the left-most list is for. Use the ‘+’ button under the left ‘CPU Sets’ list. Then select another processor group from the dropdown in the upper-right. Select the CPUs from that group to add a second CPU Set. That is why the term ‘CPU Sets’ is plural, because you can specify more than one set!
Persistent (Sticky) CPU Sets are fully supported by Process Lasso.
Read more about CPU Sets at MSDN.
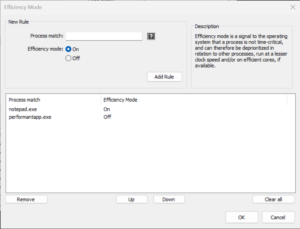
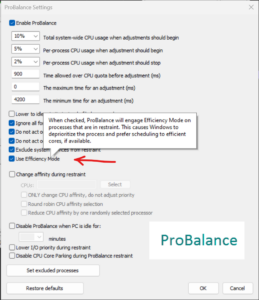
Efficiency Mode, introduced in Windows 11, provides a signal to the operating system that a process is not time-critical, and can therefore be deprioritized in relation to other processes, run at a lesser clock speed and/or on efficient cores, if available.
Although this was a welcome addition to Windows, there was no way to persist the setting – until now. With Process Lasso, users can now persist Efficiency Mode ON or OFF for specific processes. The OFF setting is useful for processes that get inappropriately classified as efficient. For instance, you may want to ensure that Efficiency Mode is OFF for a performance critical process. This will keep Windows from scheduling it to E-cores and/or taking other energy saving actions.
So that users can know which running processes are in Efficiency Mode, we added an indicator to the Status column, and moved its default position farther left. The ‘Running’ status shown in previous versions is now implied, so the field will be blank if there’s no other notable status. Therefore, the process status may now be any combination of those listed below. Meanwhile, in the Rules column, the symbols indicating Efficiency Mode always ON or OFF are ‘E’ and ‘e’, respectively.
Status column values:
Rules column symbols:
Importantly, some processes will have individual threads classified as efficient, rather than the whole process, and that won’t currently be reflected in Process Lasso. In these cases, setting an Efficiency Mode OFF rule will ensure that no threads in the process are classified as efficient.
Users can set Efficiency Mode for a running process by using the context menu, for either the current instance only, or every time that process is run (the ‘always’ submenu).
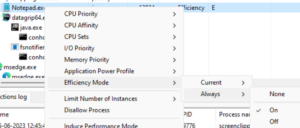
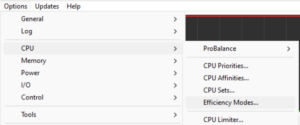
The Efficiency Mode rules can be managed at app menu item ‘Options / CPU / Efficiency Modes…‘.
We’ve also tied Efficiency Mode into ProBalance, with a new option to turn on Efficiency mode while a process is being acted on by ProBalance. The option defaults to OFF because Efficiency mode is much more heavy-handed than ProBalance’s stock behavior.
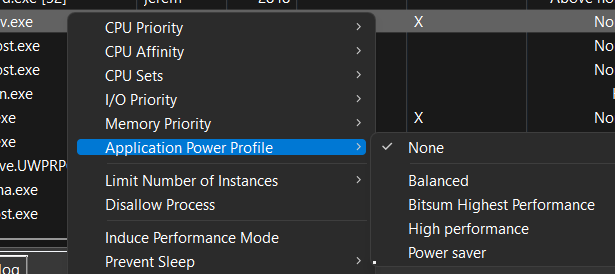
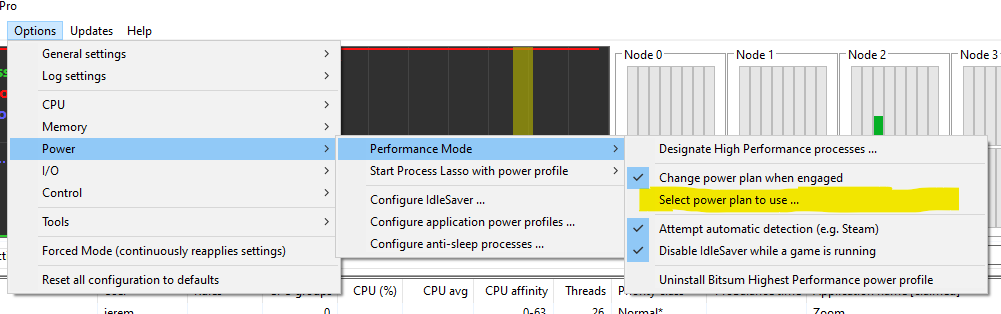
The user can create rules to that cause the system to enter the chosen power plan when specified processes are running. When they terminate, the system is returned to the previous power plan. This lets users target their system power plan to specific applications. You can do this by right-clicking on a process, using the ‘Application power profile‘ submenu, or by the menu option at ‘Options / Power / Application Power Profiles …”.
This option allows you to specify the power plan that the system should be in both when Process Lasso first starts (before any rule enforcement), and when there are no power rules active. It is useful to prevent cases where the system ends up in an undesired power plan due to conflicting simultaneously active power rules or external changes to the power plan.
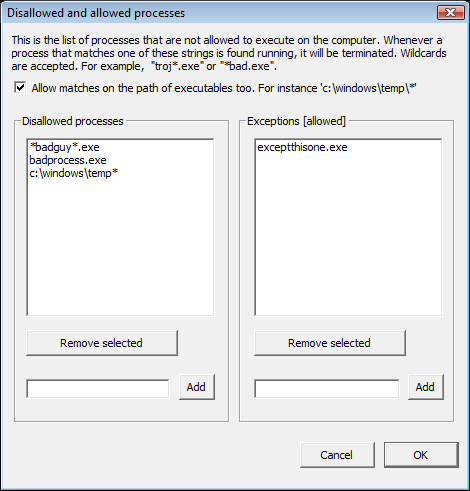
The processes listed here will get terminated when they are found to be running. Process Lasso can not (at present) actually prevent them from trying to start up, it just immediately terminates them when it finds them running.
Foreground Boosting will raise the priority class of the process currently in the foreground. Windows already does a foreground priority boost, and further boosting is usually not effective. ProBalance works in the opposite direction, lowering the priority class of problematic background processes, for a reason. Still, Foreground Boosting can be useful in some environments, and on Alder Lake is an easy way to signal to the Windows scheduler that the foreground process should prefer P-cores.
NOTE: Do not confuse Foreground Boosting with the “Boost” submenu that controls Windows Dynamic Thread Priority Boosting.
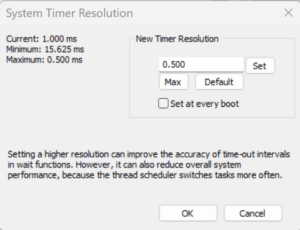
This is a built-in tool to persist adjustments to the System Timer Resolution, in up to 0.5ms increments. Other tools on the market didn’t allow the user to persist this change, thus required it be manually re-applied at every boot. We can’t speak to general efficacy of this tweak, although have no doubt there are cases where it is desirable. Importantly, starting with Windows 10 2004, for processes that do not themselves request a specific timer resolution, this adjustment will have no impact unless you have checked ‘Apply globally’.
From MSDN:
Prior to Windows 10, version 2004, this function affects a global Windows setting. For all processes Windows uses the lowest value (that is, highest resolution) requested by any process. Starting with Windows 10, version 2004, this function no longer affects global timer resolution. For processes which call this function, Windows uses the lowest value (that is, highest resolution) requested by any process. For processes which have not called this function, Windows does not guarantee a higher resolution than the default system resolution.
Starting with Windows 11, if a window-owning process becomes fully occluded, minimized, or otherwise invisible or inaudible to the end user, Windows does not guarantee a higher resolution than the default system resolution. See SetProcessInformation for more information on this behavior.
Setting a higher resolution can improve the accuracy of time-out intervals in wait functions. However, it can also reduce overall system performance, because the thread scheduler switches tasks more often. High resolutions can also prevent the CPU power management system from entering power-saving modes. Setting a higher resolution does not improve the accuracy of the high-resolution performance counter.
timeBeginPeriod function (timeapi.h) – Win32 apps | Microsoft Learn
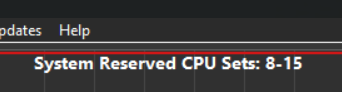
System Reserved CPU Sets is a kernel registry option that instructs the system to avoid using a particular set of CPU cores, which you can then dedicate to your real-time applications. Unlike per-process CPU Sets rules, this setting applies to the entire system.
WARNING: This is a draconian action that can persist after Process Lasso is uninstalled, though you will be prompted to remove it. Furthermore, application incompatibilities may exist and complications could arise from CPU affinity rules that include both reserved and unreserved cores.
This setting will prevent your system from being able to make full use of your CPU cores since you’ve reserved some of them. Additionally, this setting will disable core parking for reserved CPUs cores.
A system restart is required after changing this setting.
We recommend trying other features first before adjusting this kernel option, if for no other reason than the possibility of this value getting set, then forgotten about and forever impacting system performance.
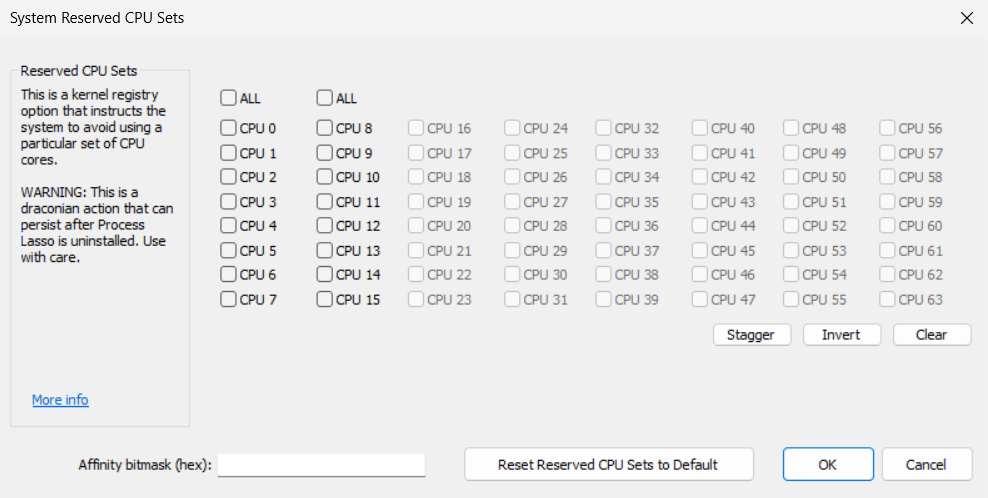
When a System Reserved CPU Sets value is set Process Lasso will show it on the graph.
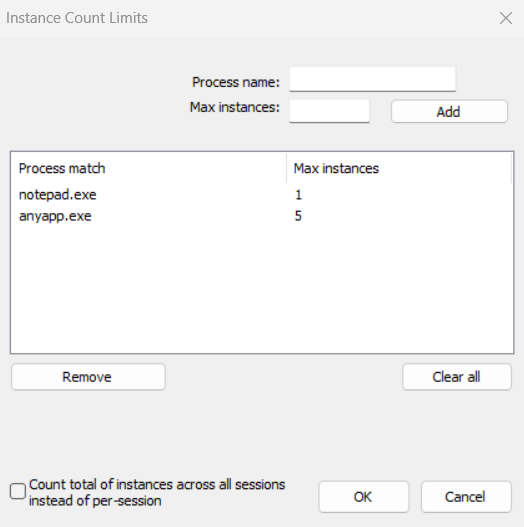
The user can limit the number of instances of a process allowed to be running at the same time (per user session) with this dialog. New instances of processes will be terminated if they match a pattern here and the number of instances is already equal to, or greater than, the instance count limit.
The user can ensure certain processes are kept running by entering in this dialog. This way, they can restart on crash, or restart if they become unresponsive. You can set this by right-clicking on a process, using the ‘Keep process running’, or by using application menu option at ‘Options / Control / Keep Running (auto-restart)…’.
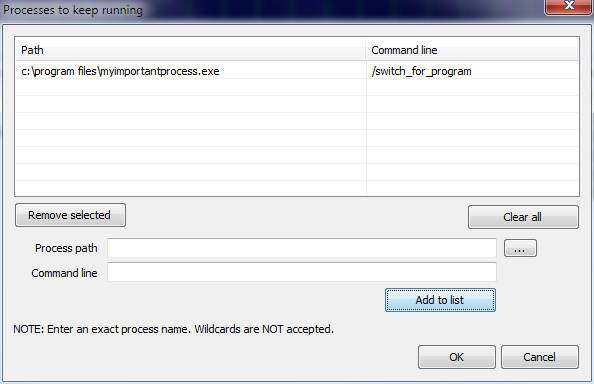
Processes will be launched in the user context of the Governor. Therefore, by using the Keep Running feature, you will be prompted with the option to change the Governor startup type to that of normal process instead of service. If you want your launched processes to interact in the user session, you should do that.
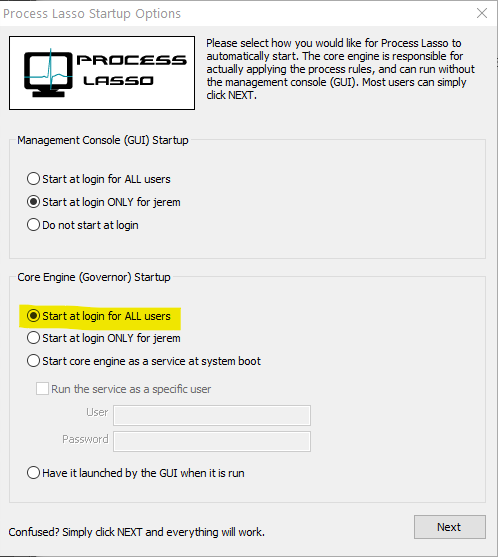
If you want to manually change the Governor startup type to GaaP, open menu item ‘Options / General / Configure Startup’ and select ‘Start at login for ALL users’ for the Governor deployment type in the bottom portion of the first dialog. If you later want to go back to a service, select ‘Start core engine as a service a system boot’.
As part of security hardening, any process that Process Lasso launches runs unelevated unless you’ve previously set a registry option to launch them elevated.
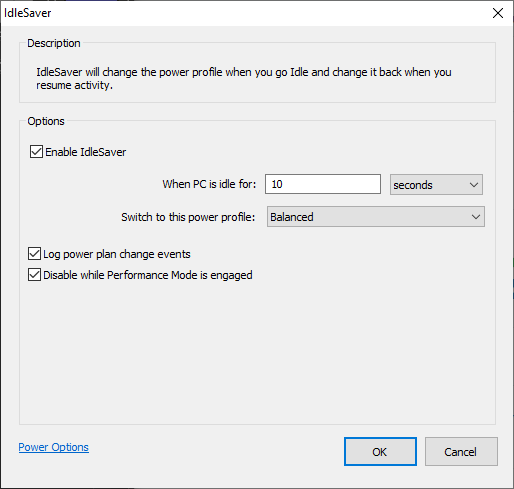
IdleSaver enables users to configure a power plan specifically for times when the system is idle. This feature allows users to utilize a high-performance power plan during active periods without entirely forgoing energy savings, as the system automatically switches to a more conservative power plan when the user is idle.
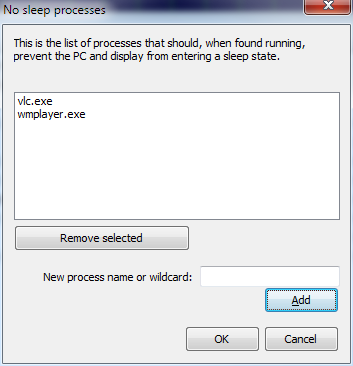
The user can prevent the PC and display from entering a sleep or hibernate state by adding them to the ‘anti-sleep’ list. This can be done by right-clicking on a process, using the ‘When running’ menu, or by using application menu option at ‘Options / Configure Anti-Sleep processes …’.
The process watchdog (“if, then” rules) allows for you to take an action on a process when it exceeds a certain amount of CPU or Memory. You can specify actions such as Restart, Terminate, Log, Execute (external), or Change Affinity. With both memory and CPU triggers, you can set a time the process must exceed this threshold before action is taken.
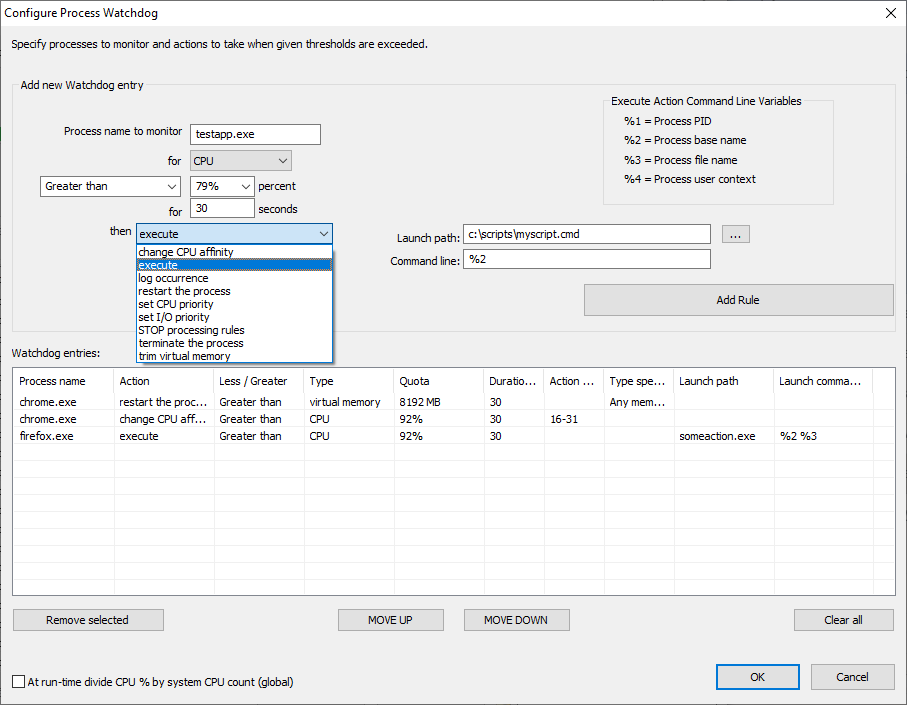
There are several actions and trigger types.
This feature supports Regular Expressions for more complex and precise matching.
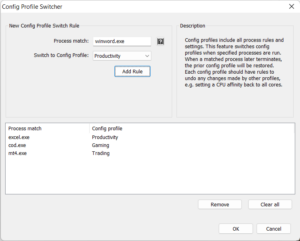
Config Profiles are named collections of all process rules and settings. This allows users to create sets of rules for specific workloads, for instance ‘Gaming’ and ‘Productivity’. Previously, these config profiles had limited utility because they couldn’t be automatically switched to when a particular process was run.
The Config Profile Switcher fills the gap by switching config profiles when specified processes are run. When a matched process later terminates, the prior config profile will be restored. Each config profile should have rules to undo any changes made by other profiles, e.g. setting a CPU affinity back to all cores.
This feature should be used sparingly. If multiple simultaneous running processes match different config switcher rules, only the oldest process will have its config enforced.
Note that process changes from the previously active config profile aren’t automatically undone. Instead, rules must be created in the other config profile(s) to counteract any previous changes. For instance, if a profile changed the CPU Affinity of notepad.exe, the other profile(s) must have CPU Affinity rules to undo that change, if desired.
The Config Profile Switcher supports wildcards and advanced process match rules.
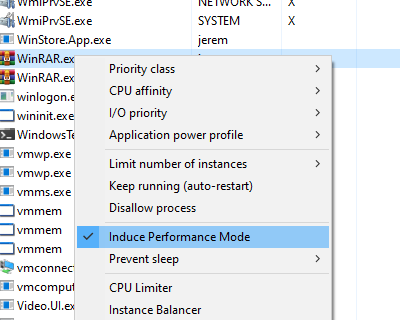
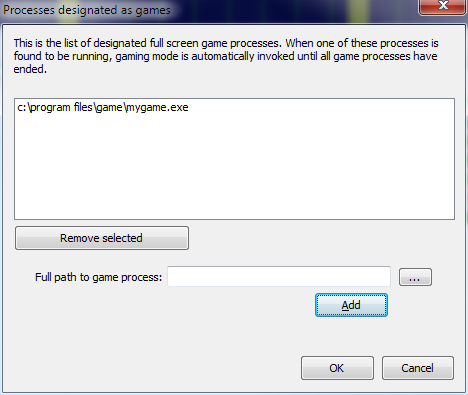
Performance Mode is a state that triggers a set of actions to ensure maximum performance. Users can designate processes to ‘Induce Performance Mode’ while they are running, or rely on the automated game detection enabled by default.
The set of actions Performance Mode takes is currently limited to switching the active power plan (profile), and excluding the target process from ProBalance – though the latter is not usually necessary given ProBalance’s default set of exclusion criteria (i.e. foreground process). However, in the future, other actions, such as adjustments to the ProBalance algorithm may occur. For this reason, we recommend using Performance Mode over a simple Application Power Profile rule.
Users can designate a ‘High Performance’ process by right-clicking on a process and checking the ‘Induce Performance Mode‘ menu item, or by using application menu option at ‘Options / Power / Performance Mode’.
Users can select an alternate power plan to use with Performance Mode, instead of the default of Bitsum Highest Performance.
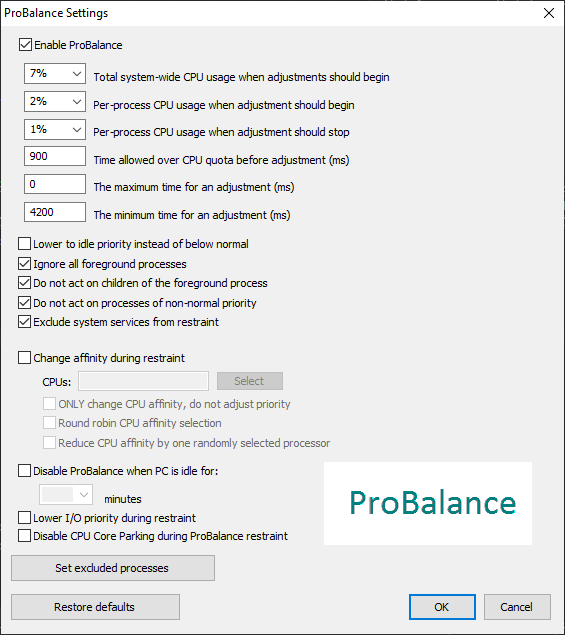
Our ProBalance feature is documented here.
There are several advanced ProBalance parameters that can be adjusted, but generally the defaults are good and the user should be cautious tweaking these settings.
It is often not necessary to set name based ProBalance exclusions since the other factors taken into consideration cause ProBalance to ignore most processes that shouldn’t be acted on. However, if you notice a process being acted on by ProBalance in the logs or Insights that you don’t want touched, then you can specify a named exclusion.
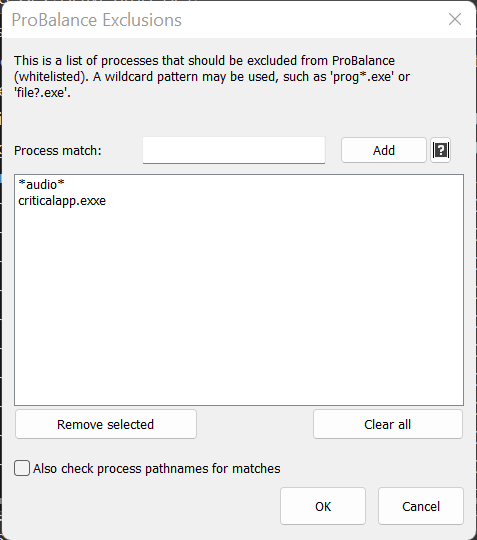
This feature supports Regular Expressions for more complex and precise matching.
First, it is important to note that the CPU Limiter is not a magic bullet to reduce CPU utilization without consequence. CPU utilization occurs because a process is doing something. Limiting that consumption will slow or otherwise impact the process. Our ProBalance technology does wonders for system responsiveness during high loads without actually reducing CPU use.
However, in some circumstances, it is desirable to reduce a process’s CPU use to achieve more fair access to system resources. This is common in Remote Desktop Services (RDS) environments, or when non-critical background processes are consuming too large a share of system resources. In those cases, the CPU Limiter is a great option.
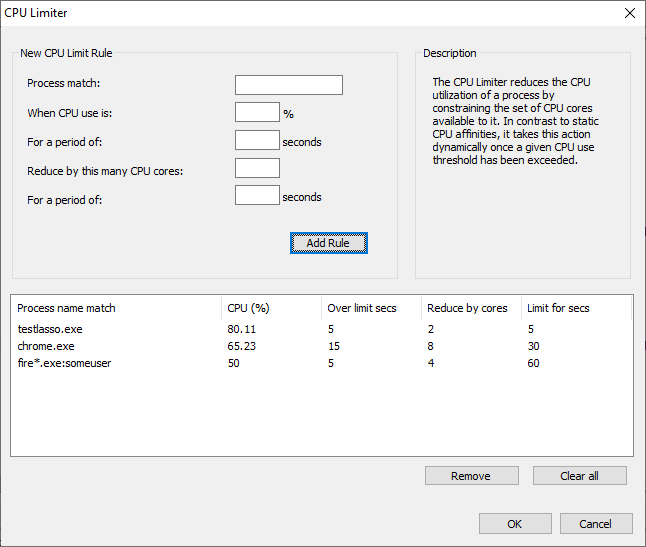
The CPU Limiter can dynamically reduce the CPU use of running processes by temporarily constraining their CPU affinity. For instance, on a 4 CPU core system, constraining the CPU affinity by 1 core limits the total possible CPU utilization of that process to 75%.

The user creates rules telling the CPU Limiter which processes to act on, and when. When a process match exceeds a threshold over some period, it is limited for the configured duration. Like other rules in Process Lasso, process matches can include wildcards and user names.
The CPU cores removed from a process’s CPU affinity are selected randomly from the set of its original CPU affinity. Once the act-for duration elapses, the original CPU affinity is restored.
While one could accomplish a similar function with a combination of Watchdog rules, the CPU Limiter is easier to use. Using the Watchdog for the same effect would require two rules, one to constrain the CPU affinity when over threshold, and another to restore the original CPU affinity. Finally, the Watchdog rules are limited to statically defined CPU affinities.
The “act-for” duration can be set to 0 to indicate an indefinite change to a process’s CPU affinity.
Let’s say you have an issue with Chrome sometimes consuming all available CPU cycles, and you don’t want to set a static CPU affinity that restricts it from short bursts of 100% utilization. You might create a CPU Limiter rule such as:
chrome.exe, after 15 seconds over 30%, restrict by 2 cores for 30 seconds
If a specific user is problematic, you can append that user name to the process match:
chrome.exe:johnny
Wildcards are also supported in process and user names, such as:
fire*.exe:user*
If no user is specified, then any user matches.
This feature supports Regular Expressions for more complex and precise matching.
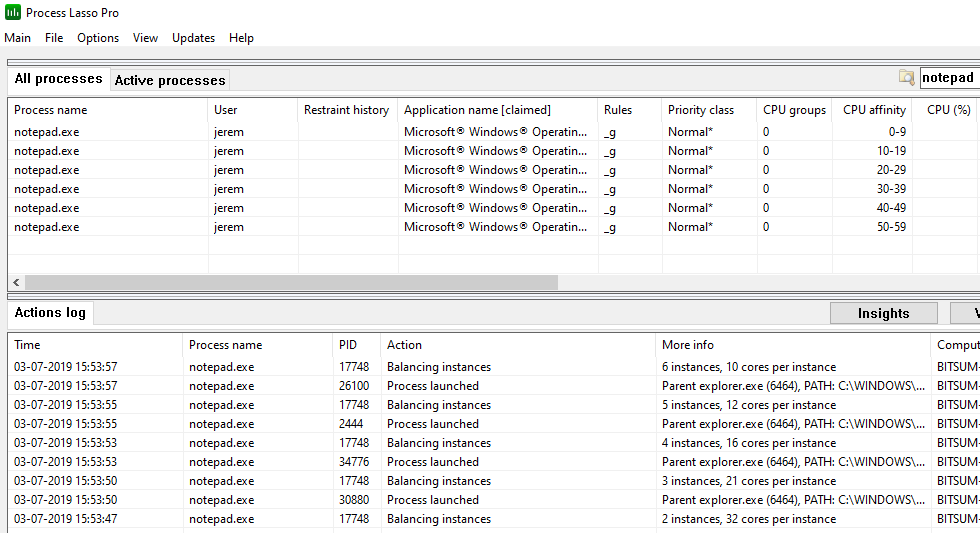
The Instance Balancer spreads CPU cores across running process instances, of either the same or multiple applications (when using advanced match rules). For example, if there are 4 instances of notepad.exe running on an 8 core system, each might get 2 CPU cores, depending on the rule. As the instance count of notepad.exe changes, the number of CPU cores allocated to each instance is adjusted.
When there are more instances than allotted CPU cores, instances are ‘stacked’ in a round-robin manner. When the instance count of managed applications changes by new process creation or termination, a re-balance occurs.
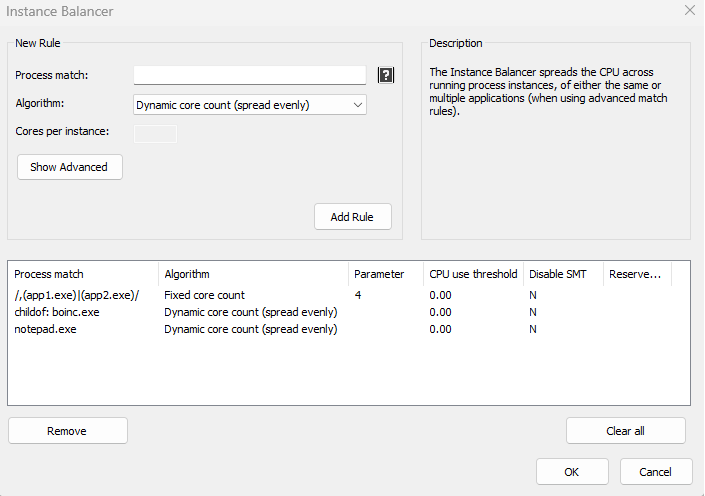
All children of a process can be matched with a ‘childof: ‘ prefix, such as childof: boinc.exe. Alternatively, it can be accomplished with RegEx, e.g. /^([^,]*,){5}boinc\.exe.*,/.
This feature supports Regular Expressions for more complex and precise matching.
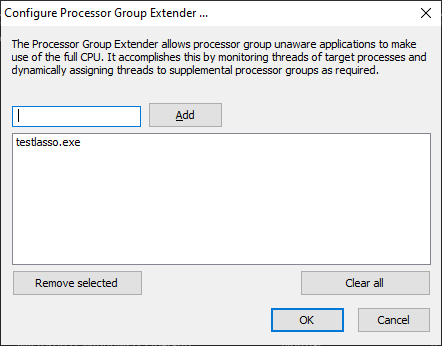
Process Lasso 9.7 adds the Processor Group Extender. This novel algorithm allows processor group unaware applications to make use of the full CPU. It accomplishes this by monitoring threads of target processes and dynamically assigning threads to supplemental processor groups as required.
Processor groups are only used on systems with more than 64 logical cores. Since Windows CPU affinities are represented as 64-bit bitmasks, processor groups were introduced to extend support to more than 64 logical cores. Thus, a CPU affinity applies to only a single processor group, and each process is assigned a default processor group when it launches. A process’s threads are restricted to that default group unless they are manually assigned to other processor groups. Typically, this thread assignment is done by the application itself. Applications that are able to assign their threads to other processor groups are group aware.
Group unaware applications will therefore be limited to a single processor group, leaving CPU cores in the other group(s) underutilized. Ideally, the application developer would update their software to be group aware, but for cases where that hasn’t happened, Bitsum now has a solution! We call it the Processor Group Extender. It monitors threads of target processes and assigns excess threads to supplemental processor groups.
Note that the Processor Group Extender is only necessary, and should only be used, in situations where an application needs additional CPU cores, but is not processor group aware. Unnecessary or inappropriate use may affect the performance characteristics of an application.
Hard CPU Throttling is a legacy feature that we don’t recommend most people use. Instead, consider the CPU Limiter or CPU Affinity rules. Hard CPU Throttling injects forcible sleeps into a process’s threads to slow the process’s CPU consumption down. This will also slow the process itself down, and potentially cause other side-effects.
SmartTrim is an intelligent memory management algorithm that can trim working sets on a per-process basis when thresholds are reached, and can also clear the system standby list (cache).

Forced Mode, available in the Options menu, is a toggle that causes rules to be continuously re-applied to running processes. This can be desirable in the case of a process that changes its own settings. Normally, Process Lasso would make a one-time adjustment to each new instance of a process, but Forced Mode causes it to evaluate whether the target settings (e.g. CPU affinity or priority class) were changed, and re-apply them if so.
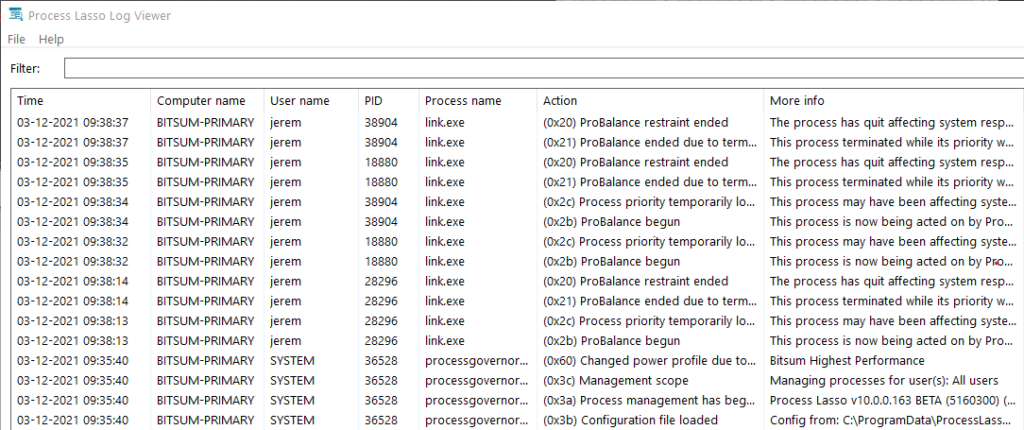
Process Lasso emits its own actions and select process events (e.g. process creations and terminations) to a CSV log. You can adjust the path to this log file via menu item ‘Options / General / Configure Startup’. Further log related settings are available at submenu ‘Options / Log’.
A dedicated log viewer tool is included to open the log for a full view beyond the Process Lasso lower pane.
By default, process command lines are not logged because they may contain user sensitive information. These can be enabled by checking menu item ‘Options / Log / Include Command Lines’.
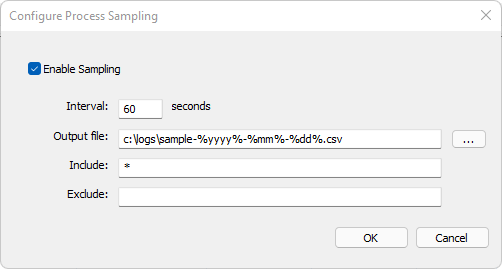
Process sampling capabilities can periodically dump a snapshot of process performance data to a CSV. This is distinct from the primary Process Lasso log, shows events such as process creation, termination, rule and algorithm enforcement.
No rotation or pruning of emitted CSV files is performed by Process Lasso, so they will grow indefinitely while sampling is enabled. We recommend using the date specifiers shown below to create unique logs for distinct periods, then a script to periodically archive or delete older logs.
Datetime format specifiers in CSV output filename:
Process Lasso works wonders on Windows Servers, including Remote Desktop Services (Terminal Services). It can prevent a single user or process from monopolizing the server’s CPU resources, improve responsiveness, and allow for full control of running processes. The fact that the core engine (governor) is separate from the GUI makes it easy to install without it being visible to the end user. For Servers, the distinct Server Edition of Process Lasso, with a 30-day free trial available. See this page for more information.
Process Lasso’s installer can run from the CLI without interaction. This is done by adding the /S switch to the installer command line. The INI configuration file may need to be precomposed with the desired rules. For that, we recommend installing Process Lasso on a workstation and using the GUI to create the rules. The installation command might look like:
ProcessLassoSetup64.exe /S /gui_start_type=current /governor_start_type=service /importconfigfrom=\\somepath\lasso\prolasso.ini
Key files for easier product activation or offline use can be requested by contacting Bitsum. They are available on to Site and Server Edition licensees. For a full listing of installer command line options, see here. Alternatively, Process Lasso’s binaries could be directly embedded in your software packages. In that case, after deployment, you’d launch processgovernor.exe with the command line switch /ConfigFolder=xxx. Launching the GUI (processlasso.exe) may not be necessary, depending on your use case. Please contact us if you require guidance on manual configuration.
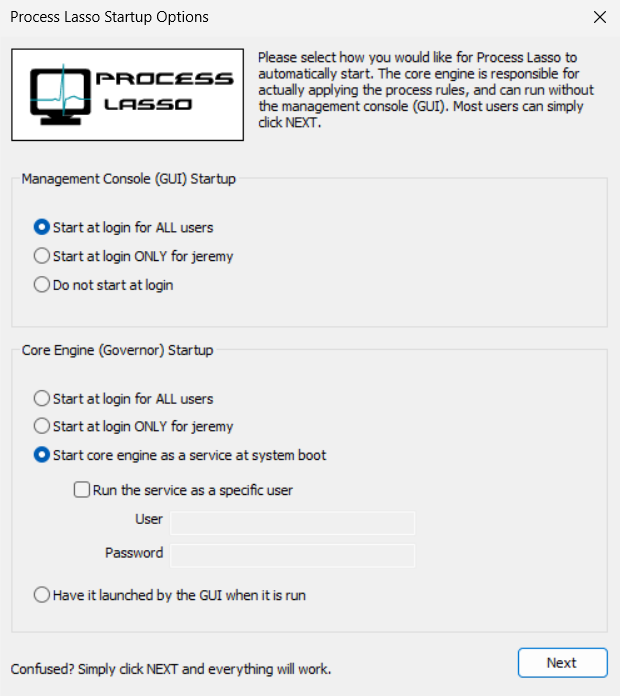
In menu item “Options / General / Configure Startup” users can configure how the Process Lasso GUI and, separately, its core engine (Governor service) should start. The GUI does not need to be running for rules to be enforced by the Governor. The Governor is entirely non-interactive, runs in the background, and has no visible presence. The GUI hosts the system tray icon and main Process Lasso window.
On systems with multiple limited user accounts, it is preferrable to only start the GUI for the current administrative user, or not at all. Otherwise, the GUI will ask for elevation when users log in. To adjust the startup type after install, use the aforementioned menu item. To configure it during install, use the installer command line /gui_start_type=current to set the GUI to only auto-start for the administrative user. You can also manually edit its Task Scheduler entry.
For the Governor, there are two primary choices:
In the config and log path presented in the second dialog, users can choose to use a centralized network configuration and log store, a per-machine store, or a per-user store.
Option 1: Centralized config and log In this mode, all workstation are configured to either (1) use a centralized configuration and log path hosted on a network share OR (2) use a machine local configuration and/or log path, but have a centralized INI configuration file pushed out to clients when changed, and the logs pulled from clients periodically. If the INI config path is a network share, it is polled for changes at least once a minute. For local paths, file-system change events are used to get notification of changes, so no polling is required and changes will be picked up instantaneously.
Option 2: Per-workstation configuration file and log In this mode, you’d install Process Lasso on each workstation and use a common configuration and log path that every user of the system would access.
Option 3: Some combination of the above, or an alternate method In the end, you can utilize Process Lasso just about however you want. You could have workstations launch it from a network share, for instance, without ever having to install Process Lasso on those workstations.
When pushing Process Lasso configuration changes out to local machine storage, it is recommended to use a script or other automated means to copy the Process Lasso configuration file to the target machines. As soon as the configuration file is over-written, Process Lasso will adopt it (no app restart necessary). Alternatively, the configuration file can be pulled by end devices. Similarly, the log files can be periodically pulled from devices.
If you have any questions about getting Process Lasso up and running in your enterprise, please contact us. Customized solutions are also available.
| Switch (defaults in bold) | Description | Examples |
|---|---|---|
| /S (case sensitive) | Performs a silent installation, also known as non-interactive or unattended. Since no configuration dialogs will be shown during install, you should compliment this switch with others (listed below) to specify how you would like Process Lasso configured. | ProcessLassoSetup.exe /S |
| /language=[English] | This indicates the language to use. If this value is not supplied, it defaults to English. Do not try to use unsupported languages, and be sure your language name is spelled as listed here (i.e. SimpChinese). Alternatively, you can specify the language’s code page number. English (1033) German (1031) Russian (1049) Polish (1045) Italian (1040) Slovenian (1060) Japanese (1041) TradChinese (1028) SimpChinese (2052) …. | ProcessLassoSetup.exe /S /language=English ProcessLassoSetup.exe /S /language=1033 ProcessLassoSetup.exe /S /language=German ProcessLassoSetup.exe /S /language=1031 ProcessLassoSetup.exe /S /language=Slovenian ProcessLassoSetup.exe /S /language=Italian ProcessLassoSetup.exe /S /language=SimpChinese |
| /gui_start_type=[all|current|manual] | This indicates whether to start the GUI at login for ALL users (all), for only the current user (current), or neither (manual). The current user is the user context in which the installer is running. | ProcessLassoSetup.exe /S /gui_start_type=all ProcessLassoSetup.exe /S /gui_start_type=current ProcessLassoSetup.exe /S /gui_start_type=manual |
| /governor_start_type=[all|current|service|manual] | This indicates whether to start the core engine (processgovernor) at login for ALL users (all), for only the current user (current), as a service, or neither (manual). The current user is the user context in which the installer is running. When /governor_start_type=service, the /username and /password switches can be used as modifiers to indicate in what user context the service should run. If a username and password isn’t supplied, it will run in the system context. | ProcessLassoSetup.exe /S /governor_start_type=all ProcessLassoSetup.exe /S /governor_start_type=current ProcessLassoSetup.exe /S /governor_start_type=service ProcessLassoSetup.exe /S /governor_start_type=service /username=myuser /password=mypass |
| /logfolder=[folder] | This indicates to use a global log folder for ALL users on the system. By default, each user has his or her own log folder in their respective application data directory. However, it is sometimes desirable to consolidate all log events into a single log folder. Be sure that this log folder is writable by contexts the governor will be running in. If set to run as a normal process, this may mean all users. If set to run as a service, it should be writable by the service user (or SYSTEM user). | ProcessLassoSetup.exe /S /logfolder=c:\systemlogs ProcessLassoSetup.exe /S /logfolder=c:\systemlogs |
| /configfolder=[folder] | This indicates to use a global configuration folder for ALL users on the system. By default, each user has his or her own configuration in their respective application data directory. However, it is sometimes desirable to use the same configuration for all users, and is required when the governor is run as a service. Be sure that this configuration folder is readable by all user contexts the governor will be running in, and writable by those who you wish to allow configuration changes. | ProcessLassoSetup.exe /S /configfolder=c:\pl_config ProcessLassoSetup.exe /S /configfolder=c:\pl_config |
| /launch_gui=[true|false] | This indicates whether or not to launch the GUI after installation. Even when the GUI is launched, it remains minimized to the system tray. | ProcessLassoSetup.exe /S /launch_gui=true |
| /importconfigfrom=[path] | This indicates to import the configuration from the file you’ve specified. This should be used in conjunction with /configfolder. The file you specify here will be the initial configuration for Process Lasso. You can specify only a folder OR a specific filename here. If you specify only a folder, “prolasso.ini” will simply be appended to the path name. | ProcessLassoSetup.exe /S /configfolder=c:\pl_config /importconfigfrom=c:\temp ProcessLassoSetup.exe /S /configfolder=c:\pl_config /importconfigfrom=c:\temp\my_default_config.ini |
| /username=[user] /password=[pass] | When running the core engine as a service (/governor_start_type=service), these switches can be used to indicate under which user you should start the service. The user MUST have permission to ‘logon as a service’ (see our FAQ for info on allowing that). If a specific user is not supplied, the core engine will run in the system context. Please remember that the Windows user password is case sensitive. | ProcessLassoSetup.exe /S /governor_start_type=service /username=myuser /password=mypass |
| /configpw=[password] | This sets the configuration password. This password is required for by the GUI when a user tries to make a change to the configuration file. Use this parameter without a value to remove any existing password. | ProcessLassoSetup.exe /S /configpw=somepassword |
| /key=[licensekey] | This sets the license key. | ProcessLassoSetup.exe /S /key=1A79A4D60DE6718E8E5B326E338AE533 |
| /keyfile=[keyfile] | This is the absolute path of the key file. Do not use a relative path. | ProcessLassoSetup.exe /S /keyfile=c:\users\admin\downloads\prolasso.key |
Command line arguments for the GUI and core engine are available. You can use them to over-ride the configuration and log paths, but this is not normally necessary or recommended. Changes to the configuration and log paths should instead be performed by the installer (preferred) or the InstallHelper application.
| Switch | Description | Examples |
|---|---|---|
| /ShowWindow | Open the main window after launching. | ProcessLasso.exe /showwindow |
| /ConfigFolder= | Indicates the configuration folder that should be used. It is assumed that ‘prolasso.ini’ will exist in it. If not, it one be created with default values. | ProcessLasso.exe /ConfigFolder=”c:\program files\Process Lasso\config” ProcessLasso.exe /ConfigFolder=c:\config\ ProcessLasso.exe /ConfigFolder=\\server1\ProcessLassoConfig\ |
| /LogFolder= | Indicates the folder containing the log files. This folder requires read and write access. | ProcessLasso.exe /LogFolder=\\server1\logfolder ProcessLasso.exe /LogFolder=c:\pslogs |
| /NoRaiseExisting | Start a new instance of ProcessLasso.exe only if it is not already running, but do not show the window of existing instance as would be the default behavior. | ProcessLasso.exe /NoRaiseExisting (NOTE: Use /no_raise_existing instead prior to v12.1) |
| /SetActiveProfile=name | Switch the active configuration profile to the indicated preexisting named profile. This command does not launch Process Lasso, it exits after changing the profile. | ProcessLasso.exe /SetActiveProfile=myprofile |
| /StartWithProfile=name | Switch to configuration profile, then launch Process Lasso. | ProcessLasso.exe /StartWithProfile=myprofile |
| /TrimNow | Signal SmartTrim to take action immediately, as and if configured. | ProcessLasso.exe /TrimNow |
| /ActivateOnly | Activate product with key previously given on installer command line, then exit. | ProcessLasso.exe /ActivateOnly |
| Switch | Description | Examples |
|---|---|---|
| /ConfigFolder= | Indicates the configuration folder that should be used. It is assumed that ‘prolasso.ini’ will exist in it. If not, it one be created with default values. | ProcessGovernor.exe /ConfigFolder=”c:\program files\Process Lasso\” ProcessGovernor.exe /ConfigFolder=c:\config\ ProcessGovernor.exe /ConfigFolder=\\server1\ProcessLassoConfig\ |
| /LogFolder= | Indicates the folder containing the log files. This folder requires read and write access. | ProcessGovernor.exe /LogFolder=\\server1\logfolder ProcessGovernor.exe /LogFolder=c:\pslogs |
The Process Lasso JSON schema is published here.
In some cases, games are protected by anti-cheat systems that restrict access to the process.
Setting the CPU affinity on games protected by anti-cheat processes can be accomplished with Process Lasso indirectly by setting the CPU affinity, or other rules, on the game process launcher, such as steam.exe or epicgameslauncher.exe. After doing that, when new games processes are launched they will inherit the CPU affinity from their parent process.
Alternatively, some users experiment with System Reserved CPU Sets, a special form of CPU Sets that applies to the entire system. However, that is a draconian action that offers less precision than per-process settings.
Another option, but only for priorities, is to use the new “Enforce By Registry” options present for all priority rules. This uses a native Windows method to persist the process priority. Since the priority is applied at the time of process creation, it can work on inaccessible processes such as those protected by anti-cheat systems.
The ‘process match’ can be a simple process name, wildcards, or even a Regular Expression checked against multiple process attributes, such as the user and command line.
Traditional process name matching uses a simple wildcard match, with ‘?’ indicating any single character and ‘*’ indicating a sequence of any characters. It is case insensitive. The user name may be appended to the match string with a colon. Depending on the feature, after toggling on path or command line matching, those fields are also compared to the match phrase.
Examples (non-Regex):
chrome.exe
 Match any process named chrome.exe

chrome*
 Match any process that begins with 'chrome'

chrome.exe:bob
 Match any process named chrome.exe running under user 'bob'
Process Lasso supports Regular Expression (RegEx) matching to multiple process attributes. This allows for the creation of complex rules that were not previously possible. For instance, a rule could act on Chrome.exe or Firefox.exe when user is Bob or Jeremy. Previously, this would require 4 different rules, and in the case of the Instance Balancer, combining them into a single group was not possible. Features supporting Regular Expressions:
Support for RegEx will be come to other features in future versions of Process Lasso.
A Regular Expression is a language for pattern matching (and substitution). It has been in use for decades and enjoys widespread support.
| A regular expression is a special text string for describing a search pattern. You can think of regular expressions as wildcards on steroids. You are probably familiar with wildcard notations such as *.txt to find all text files in a file manager. The regex equivalent is .*\.txt. – RegexBuddy |
Read more: Quick Reference (Microsoft) RegEx101 Tester
When matching a RegEx, Process Lasso concatenates multiple fields about the process. The format of this consolidated process information string is:
PID,User,ProcessName,Path,ParentPID,ParentName,,,,CommandLine (always last)
PID process ID User user under which process is running Process basename of process Path file path of process image ParentPID parent ID Parent parent process name CommandLine instance command line (this field is always last. Its index is subject to change if new fields are inserted later!) In this way, an expression can match to anything in the concatenated string, or only to specific fields, depending on how precise the expression is. With Process Lasso, Regular Expressions are differentiated from traditional match phrases by encapsulation in forward slashes (e.g. ‘/myregex/’). All matching is case insensitive. Embedded commas in a field (normally only in the command line field) are escaped with a backslash, so for precise rules this should be taken into account.
While RegEx allows for powerful matching on multiple patterns and fields, it can also be used in simple ways:
/firefox.exe/
 Match 'firefox?exe' anywhere in any field. Note '.' is a wildcard in RegEx, but you can escape it like 'firefox\.exe' for more precision.

/,firefox\.exe/
 Match only firefox.exe at the start of a field (>0)

/,fire*.exe/
 Match only 'fire*exe' at the start of a field (>0)

/,(fire*.exe)|(chr*.exe),/
 Match 'fire*exe' or 'chr*exe' at the start of a field (>0)

/,app[123]\.exe/
 Match if any field is app1.exe, app2.exe, or app3.exe (>0)

/,bobsmith/
 Match user bobsmith at the start of a field (>0)

/10280,/
 Match PID 10280. (simplified form, technically this could match other fields)

/,.*-type=renderer(^,)*$/
 Match '-type=renderer' anywhere in last field (command line). Note starts with a comma, then ends before a new field occurs (see below for embedded commas).

/,.*-type=renderer[^(,)|(\\,)]*$/
 Prior with handling of escaped embedded commas in the command line.
To match specific fields, an expression such as this can be used to match specifically field 3 (the process name):
^([^,]*,){2}
 Explanation:
 ^ = Starts at beginning of string
 ([^,]*,) = Not a comma repeated zero or more times, followed by a comma
 {2} = Repeat prior match (a comma delimited field) 2 times
/^([^,]*,)(jeremy)|(bob),/
 Match processes with username of jeremy or bob

/^([^,]*,){2}chrome\.exe,/
 Match processes named chrome.exe

/^([^,]*,){2}.*chr.*,/
 Match processes whose name contains ‘chr’

/^([^,]*,){2}(chrome\.exe)|(firefox\.exe).*,/
 Match processes chrome.exe or firefox.exe

/^([^,]*,){5}boinc\.exe.*,/
 Match processes that are children of boinc.exe

^([^,]*,){2}conhost\.exe,([^,]*,){2}boinc\.exe.*,
 Match processes named conhost.exe that are children of boinc.exe

/^([^,]*,)(jeremy)|(bob),chrome\.exe/
 Match processes whose name is chrome.exe under user of jeremy or bob.

/^([^,]*,){2}chrome.exe,.*,.*-type=renderer[^(,|\\,)]*$
 Match process name ‘chrome.exe’ and has '-type=renderer' in the command line (last field)

/^([^,]*,){3}.*\\program files.*/
 Match path containing ‘\Program Files\’ (matching is case insensitive).
How to test Regular Expressions To test your Regular Expressions, we recommend this site. We’ve preloaded a sample of what you’d be matching against, again with fields being (also see above):
PID,User,Process,Path,ParentPID,Parent,,,,CommandLine (always last)
Alternatively, create a text file with row(s) simulating Process Lasso’s provided match string. Then use grep (WSL or Linux) or another tool to match RegEx. Note that the encapsulating forward slashes need to be removed. An example is:
sample.txt:
20116,jeremy,chrome.exe,C:\Program Files (x86)\Google\Chrome\Application\chrome.exe,19233,chrome.exe,,,,"C:\Program Files (x86)\Google\Chrome\Application\chrome.exe" --type=renderer
test command:
grep -P 'chr.*' sample.txt