Process Lasso 11.0 – Tree View and Graph Tooltips
This release of Process Lasso adds a processes tree view and more helpful graph tooltips!
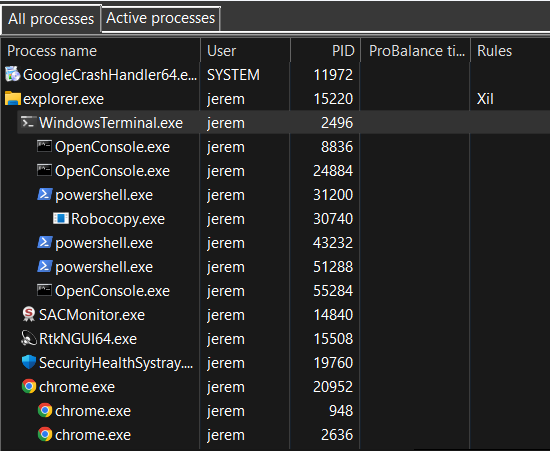
Processes Tree View
The tree view, now the default, provides a way to visualize the process parent/child hierarchy. Many applications spawn child processes, resulting in several same-named instances, thus this new tree view makes managing them easier. It also helps with visualizing the state of the system and specific user activity.
Left-clicking on the ‘Process name’ header will rotate between tree and classic ordering. Left-clicking on any other column will end the tree view and sort by that column. Alternatively, the tree view can be toggled via a ‘View’ menu item.
Going forward in the v11 series, we’ll be refining this tree view, extending its capabilities and adding context menu actions to act on an entire subtree.
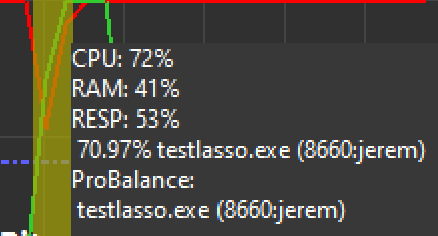
Graph Tooltips
The graph now displays a tooltip with basic stats and the most active process at any X coordinate. We plan to expand this capability to provide even more helpful information about historic process activity. For now, this will give you some indication of the top CPU-consuming process at any time.
Wrap-Up
Process Lasso has seen tremendous improvements over the last few years, offering many new features and improving existing ones. We believe this major release provides a good platform from which to continue innovating. We thank our users for their continued support of our endeavors!
Process Lasso v11.0.0.34 Changelog – Aug 15 2022
- Processes tree view
- More useful graph tooltips
(1) GUI: Enlarge and improve Disallowed Processes config dialog
(1) GUI: Remove 'do not ask again' option from real-time priority class warning messagebox
(1) GUI: Move 'Options / General / Reset Do Not Show Again Memory' to 'View / Reset'
(1) GUI: All Processes tab: Add column for parent process PID and basename
(1) GUI: All Processes tab: Add tree view (3rd sort option for name column)
(9) GUI: Show graph tooltip at any point, giving most active process, CPU utilization, and ProBalance events at that time
(11) GUI: Add Clear Log menu item under 'View / Reset'
(11) GUI: Add CTRL+X accelerator to clear log
(17) GUI: Restore 'Buy now' button above lower pane for unlicensed users
(21) GUI: Switch to native messagebox for some locations where choice can't be persisted by user (e.g. terminate now)
(21) GUI: Add CTRL+F accelerator to jump to filter edit controls
(23) GUI: Change name of Instance Balancer 'static core count' algorithm to 'fixed core count'
(23) GUI: Add tooltips to Instance Balancer config dialog
Discover more from Bitsum
Subscribe to get the latest posts sent to your email.